Model v3: the cascade
The xG model now asks three questions about every shot attempt: does it get through, does it hit the net, does it go in? Each stage gets its own player ratings, and that is how shot blocking became a number here.
TL;DR: The xG model behind this site now asks three questions about every shot attempt instead of one: does it get past the defenders, does it hit the net, and does it go in? Splitting it up this way lets me rate players on each question separately, which is how shot blocking became a number here.
Three questions instead of one
A shot attempt has to survive three things before it's a goal. First it has to get past whoever is in the lane, and about a quarter of attempts don't. Then it has to hit the net, and nearly a third of the ones that get through miss. Only then does the goalie get a say. So the model scores a shot as a product of three probabilities:
xg = P(through) · P(on net | through) · P(goal | on net)
Each question gets its own model, fit on the shots that actually reached that point. The "did it get through" model sees every attempt. The "on net" model sees only the unblocked ones. The "goal" model sees only shots that reached the goalie. I adapted this structure from Micah Blake McCurdy's Magnus models at HockeyViz; he goes further with rebound and goalie stages that I haven't tried.
The reason I like it is that the three questions have different answers. Distance and angle matter for all of them, but not the same way: a point shot is easy to block and hard to score on, a shot from the slot is the reverse. One model asked only "did it go in?" has to blur those together. Three models don't.
You can see the structure in the model's own held-out predictions. These are the mean xg values the model assigned to attempts, grouped by what eventually happened to them:
| What actually happened | shots | mean xg |
|---|---|---|
| blocked | 602,587 | 0.0134 |
| missed | 503,017 | 0.0490 |
| saved | 1,126,835 | 0.0565 |
| goal | 112,235 | 0.1410 |
Held-out mean xg by outcome, recomputed from the shipped model's stored out-of-fold predictions every time the site builds. Attempts that ended up blocked were, on average, worse chances at the moment of release than attempts that got through, and goals were the best chances of all. Blocked shots don't sit at zero, and they shouldn't: the shooter doesn't know the block is coming, and neither does the model.
How good is it?
Everything in this section is held out. The model is fit in folds grouped by game, and each shot is scored by a fit that never saw its game, so these are the numbers you'd get on shots the model hadn't seen. 2,344,674 attempts over 16 seasons, 112,235 of them goals (4.8%).
Three numbers I watch. AUC is the chance the model ranks a random goal above a random non-goal; 0.5 is a coin flip. Across every attempt it's 0.826, but that's flattered by the easy part (blocked shots are easy to spot). The number I trust is AUC among shots that reached the goalie, goal vs save: 0.773. Log loss (0.1566) and Brier (0.0411) both punish confident wrong answers, and both are what I use to decide whether a change to the model is an improvement. On their own they don't mean much, so I'm giving them here mostly so they're on the record.
The more interesting read is per stage, because the three questions are not equally hard:
| stage | shots | base rate | AUC | log loss | Brier |
|---|---|---|---|---|---|
| P(through) | 2,344,674 | 0.743 | 0.904 | 0.3183 | 0.0999 |
| P(on net | through) | 1,742,087 | 0.711 | 0.652 | 0.5666 | 0.1920 |
| P(goal | on net) | 1,239,070 | 0.091 | 0.778 | 0.2598 | 0.0741 |
Each stage scored on its own universe: every attempt for the block stage, unblocked attempts for the on-net stage, on-net shots for the goal stage. Base rate is how often the "yes" answer happens.
Whether a shot gets blocked is the most predictable of the three, which makes sense: it's mostly about where the shot comes from. Whether an unblocked shot hits the net is by far the hardest. Once you know the shot type and roughly where it came from, whether it hits the net is mostly down to the shooter's execution on that play, and the model can't see that. Goal-or-save sits in between.
A model can rank shots well and still be off in its levels, so the other check is calibration: when the model says 30%, does it happen 30% of the time? Here's each stage against the diagonal.
Held-out reliability per stage, ten quantile bins each. The dotted line is perfect calibration. The final xg is the product of the three with one calibrator on top, which is what the next chart shows.
Reliability of the final xg, on log axes because most shots are worth very little. Each point is a tenth of all attempts.
Season by season, AUC on all attempts and Brier. The drift is small, which is the point of checking: one fit covers sixteen seasons of a game that has changed a fair amount.
What it learned
Three boosted-tree models, so there's no single coefficient to read off. What I can show is what each one leans on, and how its answer moves with the features that matter most.
Gain importance, top eight features per stage, from the shipped model. Distance leads the block and goal stages, but the supporting cast is different each time. The block stage leans on what happened right before the shot: how far the puck moved and how much the angle changed since the last event. A shot off a cross-ice pass finds a lane that a shot off a standing puck doesn't. The on-net stage is led by shot type. The goal stage is distance, then how long since the last shot (rebounds), then angle and game state.
Distance is the feature everyone knows about, and the three stages read it three different ways:
Model (line) vs observed (dots) by distance, 4-foot bins. Almost nothing gets blocked inside 15 feet; from the point, 40% does. Scoring falls off steadily the whole way out. The on-net panel is the odd one: shots from in tight hit the net 83% of the time, then there's a dip to about 68% around 20 feet, and from the point it's flat at 70%. Out near the blue line it climbs again, since the few long shots that aren't blocked are usually the ones with nobody in front. The dots sit on the lines almost everywhere, which is the point of the chart: the model is calibrated along distance, not just on average.
Same thing by angle off the net's centerline. Straight on is 0°; 90° is the goal line. This one surprised me. Shots from straight on get blocked the most (about a third don't get through) and shots from the wall get blocked the least (87% through from 75°). The bodies are in the middle of the ice, so the lanes are too. It doesn't help the shooter much: scoring halves from the centerline to the goal line, and hitting the net from a sharp angle is no easier.
By shot type, bars are the model's mean and diamonds are observed. Slap and wrist shots get blocked at about the same rate (roughly 30%), which is mostly a read on where they come from. Tips and deflections are the interesting row: they almost never get blocked, because there's nobody between the deflector and the net, but they miss the net almost half the time, and the ones that get there score at 17%, double a wrist shot. Backhands are the best of the ordinary shots at getting through and hitting the net.
Five player ratings, one per question
The xG model itself is blind to who is on the ice. It only knows where the shot came from, what kind of shot it was, the game state, and so on. On top of it I fit a second layer that asks, for each stage, which players do better or worse than the shot itself would predict. Those are the player ratings. Because the stages are separate, a player can be good at one and bad at another, and the ratings say so.
Five ratings ship, in the order the shot meets them:
- Getting through (shooter, stage 1): whose attempts don't get blocked.
- Blocking (defender, stage 1): who takes attempts away. This is the new one, and the first defensive player rating in the model.
- Accuracy (shooter, stage 2): whose unblocked attempts find the net.
- Finishing (shooter, stage 3): whose on-net shots beat the goalie.
- Saving (goalie, stage 3): who stops more than the chances predict.
One thing I didn't appreciate until I built it: the block stage is a much better place to measure players than the goal stage. Goals are about 5% of attempts. Blocks are about 25%. A rating fit on an outcome that happens a quarter of the time has far more to work with per shot than one fit on something that happens one time in twenty, so the stage-1 ratings settle down faster than finishing does.
Every rating has to repeat before I'll show it. I split each player's shots in half at random and check that the rating from one half predicts the other. Split-half correlations: getting through 0.54, blocking 0.50, accuracy 0.51, finishing 0.41, saving 0.50. Blocking repeats about as well as goaltending does, which is the finding the blocked-shots series is built on.
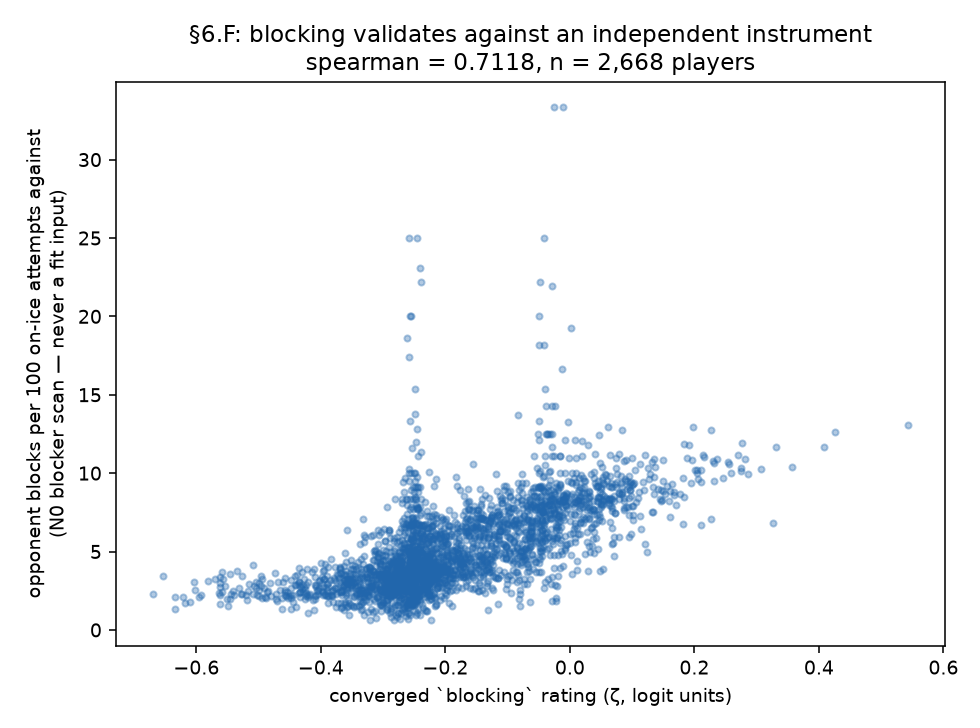
Blocking also has a check the other ratings don't. The play-by-play records who blocked each shot, and I never give that column to the model. So I can ask whether the model's blocking rating, fit without it, lines up with the blocks a player is actually credited with.
Here are the ratings as they currently ship, read straight from the artifact the site
uses (joint__baseline_xg__f3e3111e, fit on shots before 2026-06-14,
3,125 players):
One violin per rating, every fitted player included. The pile at zero is the prior: a player I don't have much evidence on gets held at league average, so a rating near zero means "not enough shots to say," not "confirmed average." The goal-stage ratings are in orange; the three to their left are what the three-question structure made possible.
Where this shows up on the site
The players table carries the shooter and defender ratings as the Sh and Blk columns, and applies them to each player's current-season shots to get goal impacts. Blocking's converted value, which is about a goal a season for the best in the league, is its own line in the player value ledger next to finishing, saving, the on-ice rate terms, and special teams. Goaltending is measured as its own object beside it.
Caveats
A few things up front, because they come up every time:
- Stage 1 runs on imputed shot locations. The NHL records where a blocked shot died, not where it was taken, so the block-stage model is partly fit on reconstructed origins. I think the imputation is defensible and I've written up how it's validated, but stage 1 inherits its error. I haven't yet done the sensitivity read of imputed rows against observed ones, and until I do, stage 1's accuracy should be read as an upper bound.
- The ratings on the players table are in-sample. The split-half numbers and the blocking check above are held-out. The ratings you see on a player's page come from a final refit on all of their shots, which is the best single estimate but isn't a held-out score.
- A rating is one piece of a player's value, not the whole thing. Finishing says nothing about how many shots a player generates; blocking says nothing about whether he's hemmed in his own zone. The value ledger is where those get combined, and the on-ice rate terms in it come from a different method entirely.
That's the model. The three-question structure is what's behind every xG number on the site now, the five ratings are shipping, and the work from here is on the product side: where the ratings surface and what the value accounting does with them.