 on-ice for◀ 5v5 offense
How to read this map
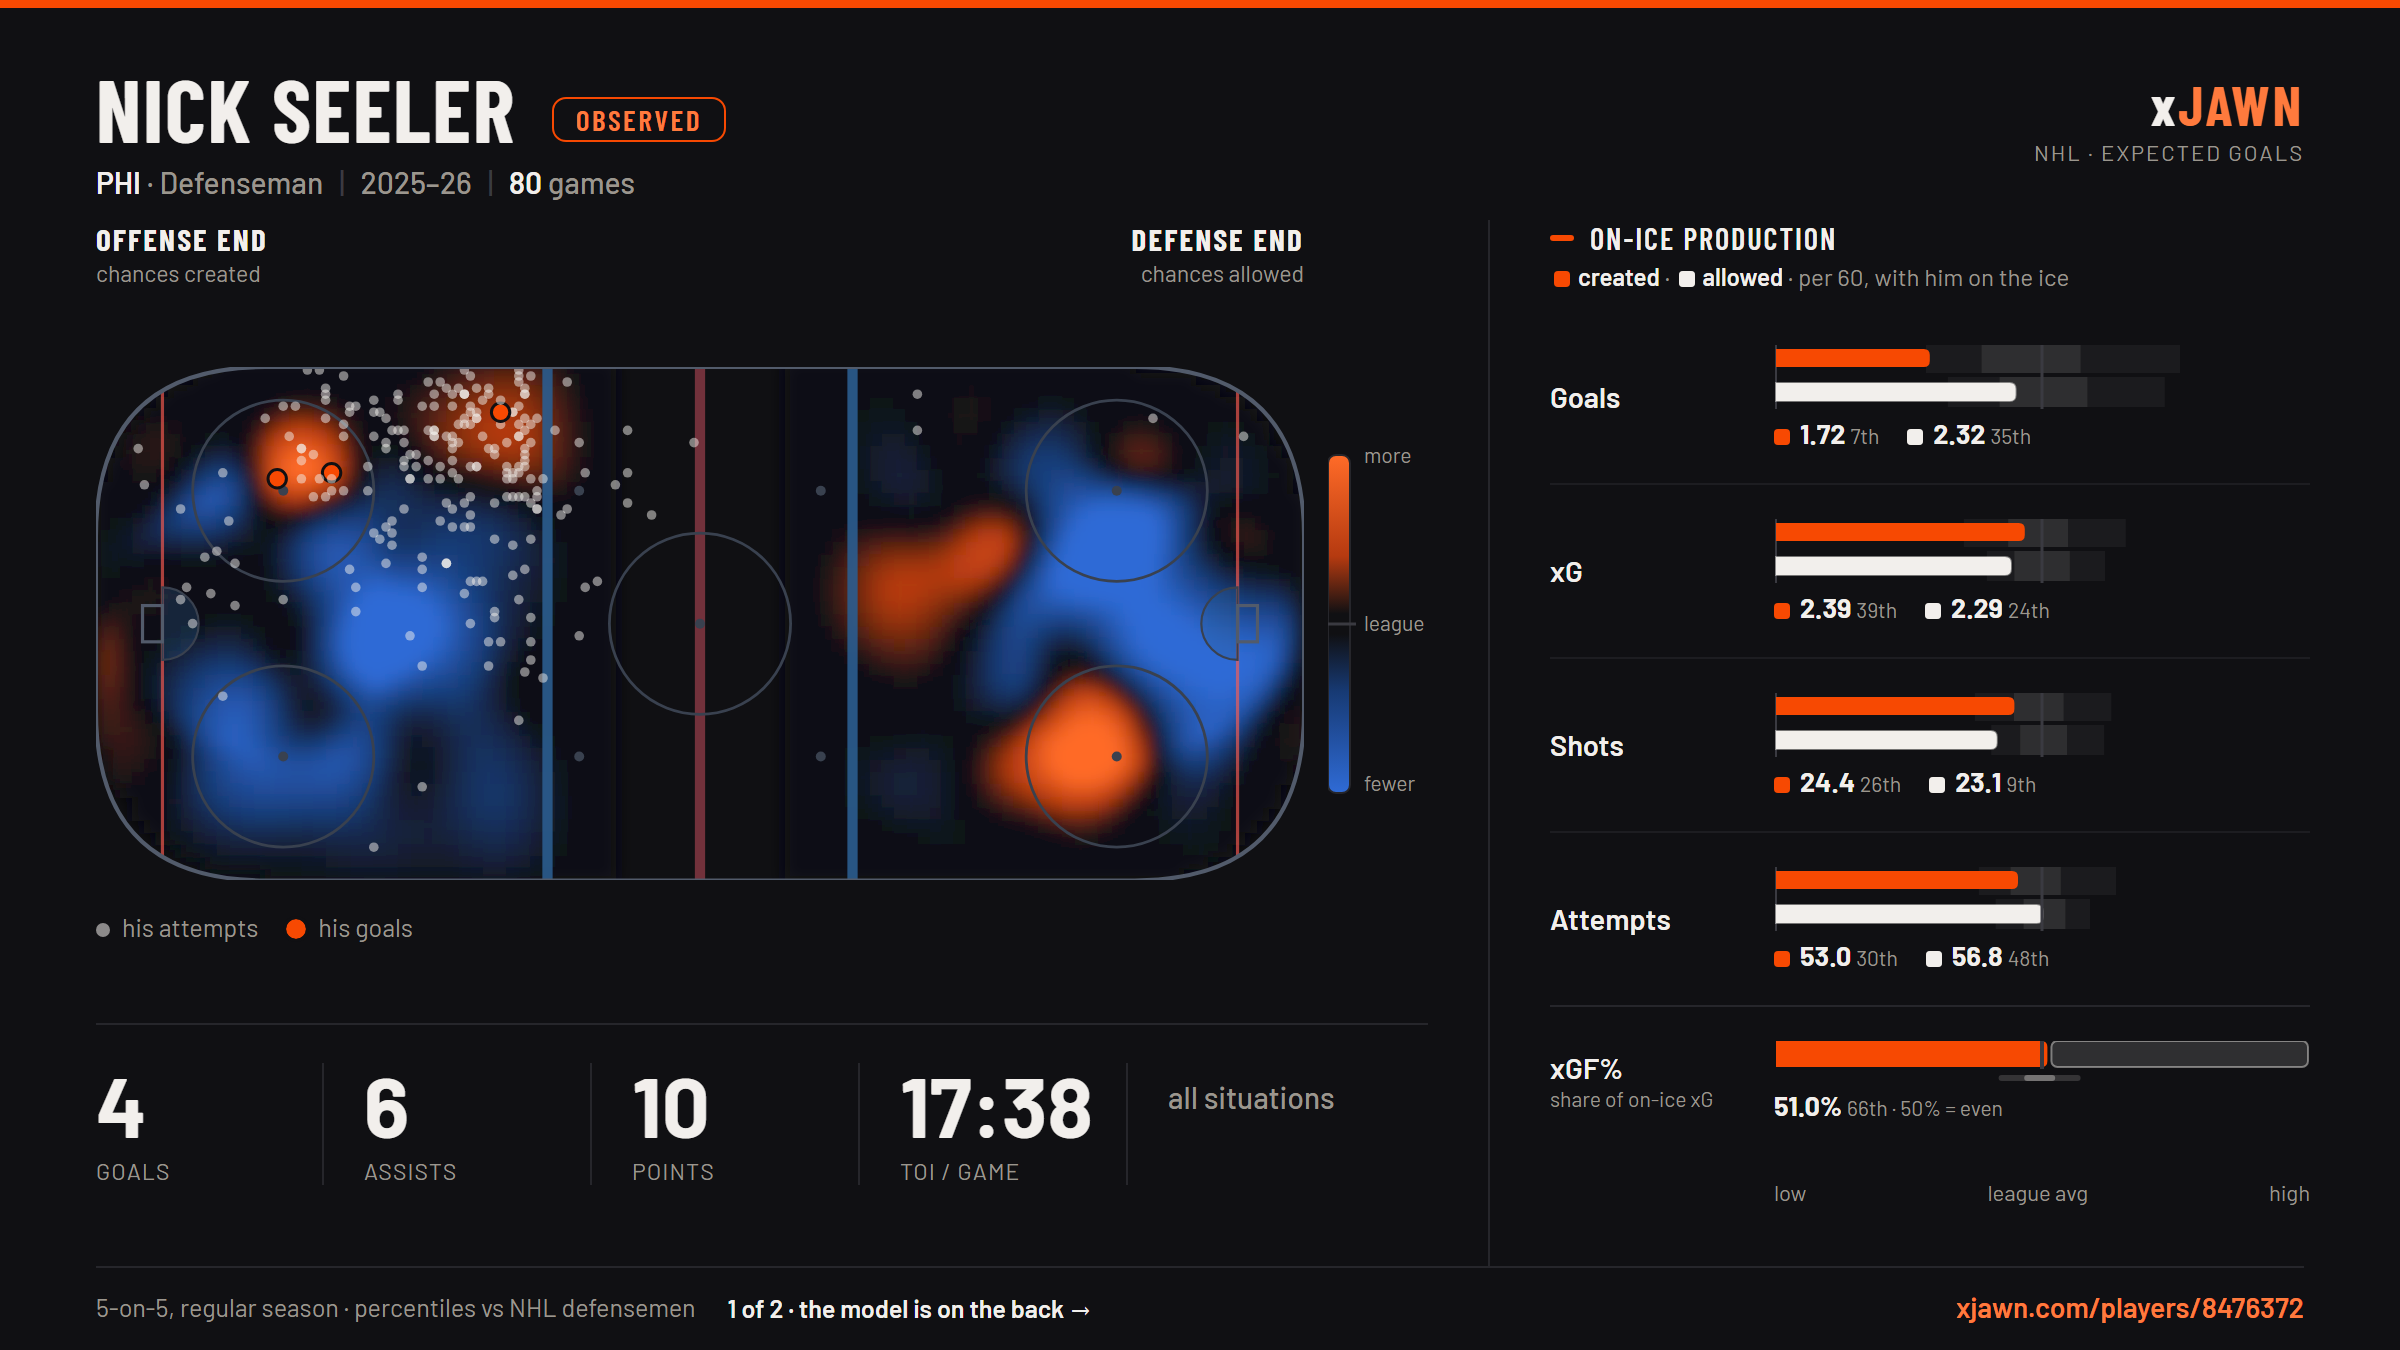
One rink, both ends while Nick Seeler is on the ice: what the team generates on the left, what it concedes on the right. Every attempt is a Gaussian bump of height = its model xG, summed per 60 minutes of ice time (a player's exposure is time, not games). The controls switch the surface (xG heatmap ↔ vs league, the league baseline per team-hour at the same strength) and the markers: × goal · • on net · ◦ missed · small • blocked — and own shots narrows the left end's markers to attempts Nick Seeler took.
The page opens at 5v5; empty-net attempts are excluded throughout. On-ice membership comes from the shift charts; attempts without usable shift coverage are absent from both ends. Blocked-shot membership cannot be cross-checked against the play-by-play, so treat blocked-marker detail as softer than the rest.
Observed production
5v5 · on-icePercentiles rank against the other defensemen over the display floor at the selected strength — a non-strength filter (rush, period, …) moves the bars but keeps that strength's spread as the backdrop.
Rolling on-ice xGF%
5v5 · on-iceModel estimates
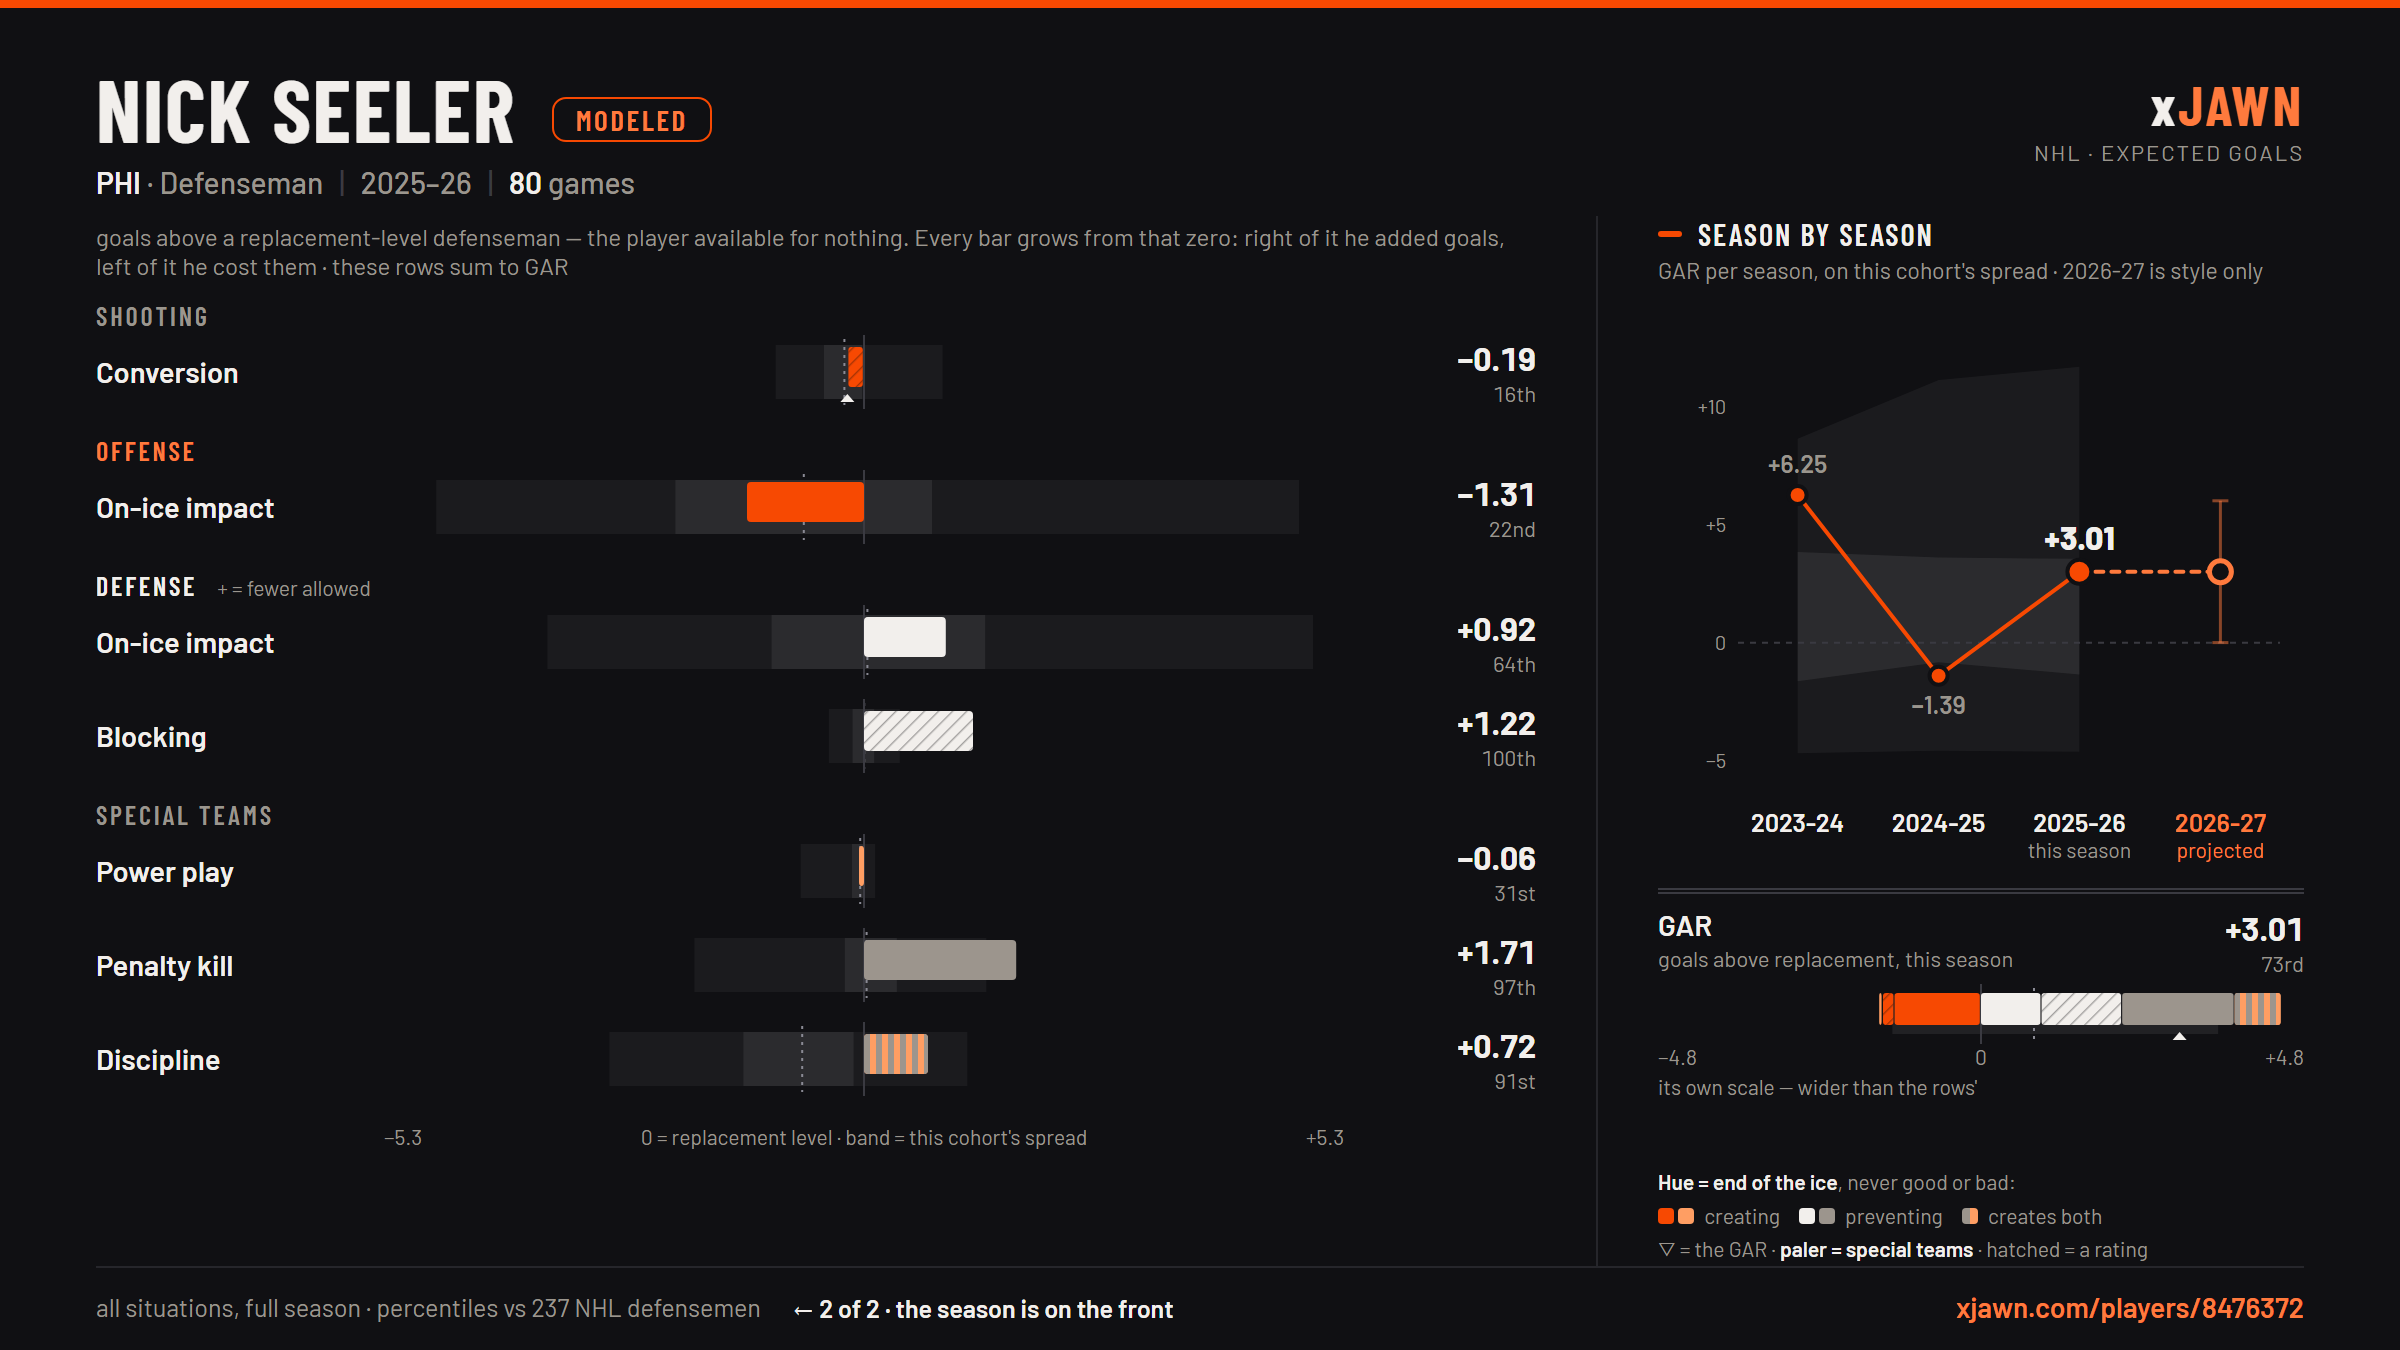
🔒 full season · not filteredRanked against defensemen; the band behind each bar is that cohort's spread (p5–p95, middle half brighter, dashed median), so where a bar lands against its band is the rank — the ordinal beside it makes that exact. Zero is whichever baseline the toggle selects — the league-average skater, or replacement level — and every row, its band and its ordinal are all drawn against that one baseline, so the bar and the number can never describe different things. Each row's bar grows from zero, so its end IS its value; the composite is the rows stacked, running both ways from zero, so only it carries a ▽ to mark the net. The rows sum to the total with nothing left over. The per-shot rating is quality only: it says nothing about how many attempts a player generates or faces, which is what the attempts figure is for.
Usage & context
descriptive · not modeledA skater absent from the fit counts as exactly cohort average (0) in QoC/QoT — the same claim ridge shrinkage makes. Penalty rates are descriptive only: taken-rate includes defensively correct penalties, and neither side is opponent- or deployment-adjusted. Nothing here is priced in goals.
Full table · all numbers
| Family | Stat | Value (current slice) |
|---|---|---|
| Observed ◆ filtered | Goals on-ice for / against | 35 / 47 |
| Observed ◆ filtered | xG on-ice for / against | 48.5 / 46.5 |
| Observed ◆ filtered | Shots on-ice for / against | 495 / 469 |
| Observed ◆ filtered | Attempts on-ice for / against | 1,075 / 1,153 |
| Observed ◆ filtered | xGF% | 51.0% |
| Modeled 🔒 season | Conversion — all shooter stages | -0.58 18th pctl |
| Modeled 🔒 season | ↳ Conversion — 243 outside the PP | 79th pctl |
| Modeled 🔒 season | ↳ Conversion — 2 on the PP | 41st pctl |
| Modeled 🔒 season | ↳ Conversion — per-shot skill | 49th pctl |
| Modeled 🔒 season | On-ice impact — RAPM · xGF impact | -2.62 19th pctl |
| Modeled 🔒 season | On-ice impact — RAPM · xGA, flipped | +0.65 65th pctl |
| Modeled 🔒 season | Blocking — Blocking · season-resolved | +1.23 100th pctl |
| Modeled 🔒 season | ↳ Blocking — 1,450 attempts faced | 61st pctl |
| Modeled 🔒 season | ↳ Blocking — per-shot suppression | 100th pctl |
| Modeled 🔒 season | Power play — ST RAPM · 3-season window | -0.06 43rd pctl |
| Modeled 🔒 season | Penalty kill — ST RAPM · season-resolved | +1.57 97th pctl |
| Modeled 🔒 season | Discipline — drawn − taken | -0.74 45th pctl |
| Modeled 🔒 season | GAA | -0.56 61st pctl |
| Context | Time on ice — all situations · min per game | 17:38 (38th pctl) |
| Context | Penalties taken — minor penalties / 60 | 0.84 (66th pctl) |
| Context | Penalties drawn — minor penalties / 60 | 0.61 (78th pctl) |
| Context | Zone starts — OZS% · O-zone start share | 52% (64th pctl) |
| Context | Score state — TOI by game state | trail 34%, tied 35%, lead 31% |
| Context | Competition (QoC) — opponents' net xG-RAPM | +0.009 (65th pctl) |
| Context | Teammates (QoT) — teammates' net xG-RAPM | -0.011 (37th pctl) |
| Context | On-the-fly — share of 5v5 TOI | 71% |
Observed values reflect the active rink filters; modeled values are fixed at their full-season fit.
On-ice numbers pair the regular-season shot set with shift-chart membership;
skaters and goalies under the display floors are fit but not shown. Modeled rows come from the
value artifact keyed to RAPM fit rapm__0cd6d075 on nested_structure__nested_structure_xg__d2ec2662
(the joint-xg structural baseline), with ratings from
joint__baseline_xg__f3e3111e (as of 2026-06-14) —
separate surfaces from the box-score xG model badged in the footer.